
Farm Category, Area, and Production Distributions
Recent refereed publications have started to provide a more accurate picture of the global farm system. The information cited here is peer reviewed and should be reproducible from cited data sources. This is in contrast to statistics found in many reports and articles issued by international agencies, who sometimes do not identify their sources.
A good place to start in our survey of global farm characteristics is Figure S10.1, which shows two gridded maps that identify a) the percentage of pixel area devoted to crop production and b) a categorical estimate of crop field size. Both are derived from the same global land use data. Categorical field size estimates can be inferred from satellite data and have been shown to correlate with farm size. Details of the mapping procedure are described in Fritz et al. (2015)
The darker shaded 1 km pixels on the cropland percentage map indicate more densely cultivated regions. The four colors on the field size map show the characteristic crop field size (from “very small” to “large”) identified with a given pixel. The dark green areas in a) are the major food producing regions. The dark blue (large field size) areas in b) generally coincide with the major food exporting areas (North America, Australia, and parts of South America). The red (very small field size) areas in b) indicate regions where smallholder farms dominate (China, India, and sub-Saharan Africa).
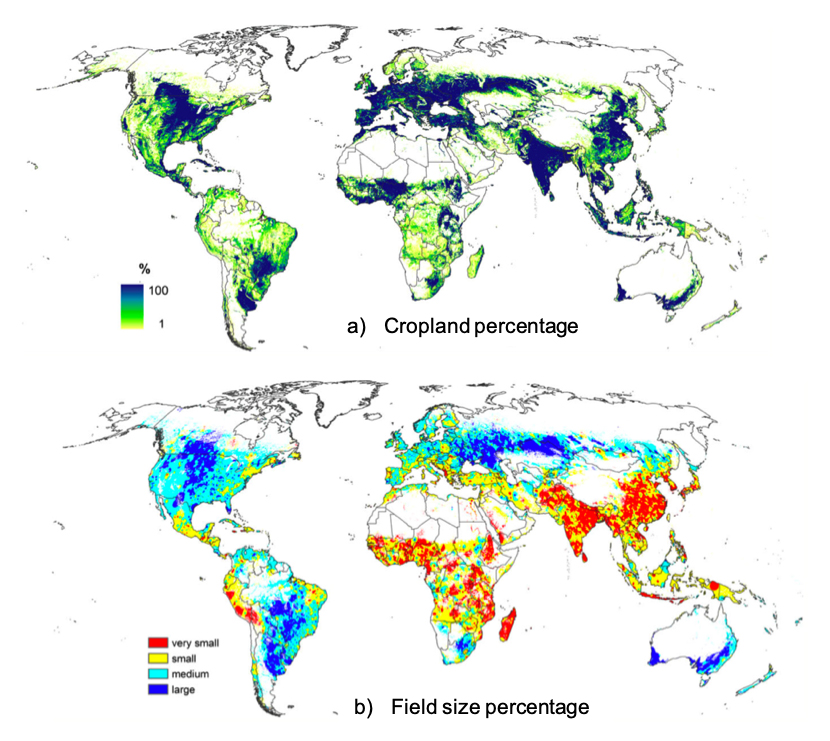
Figure S10.1: Gridded 1km pixel maps of a) percentage of land in each pixel devoted to crop production
b) characteristic field size category for each pixel. (Fritz et al., 2015).
© John Wiley & Sons, Inc. All rights reserved. This content is excluded from our Creative Commons license.
For more information, see https://ocw.mit.edu/help/faq-fair-use/.
Figure S10.2 shows information from global land census surveys conducted in 1990 and 2000 in 111 countries and compiled by Lowder et al. (2015). Panel a) shows the fraction of farms in each of several size categories, based on data from 460 million farms in 111 countries. Since the survey is reasonably inclusive the paper assumes that the fractions in the chart apply to the global total, which is estimated to be at least 570 million farms. The chart indicates that 94% of global farms are smaller than 5 ha. Based on this and a conservative assumption of up to 4 people per farm household, we can estimate that there are up to 2 billion people on farms smaller than 5 ha (perhaps more). This is roughly consistent with uncited estimates given in UN documents.
Panel a) is a snapshot of the global farm size distribution from around 1990-2000. Farm size distributions and averages change over time. The trend plot in Panel b) shows that average farm sizes in high income countries (left scale) continually increased between 1960 and 2000 while farm sizes in other countries generally decreased. African countries are indicated by the dotted line (right scale). More recent data suggest that the trends in each region still have the same direction.
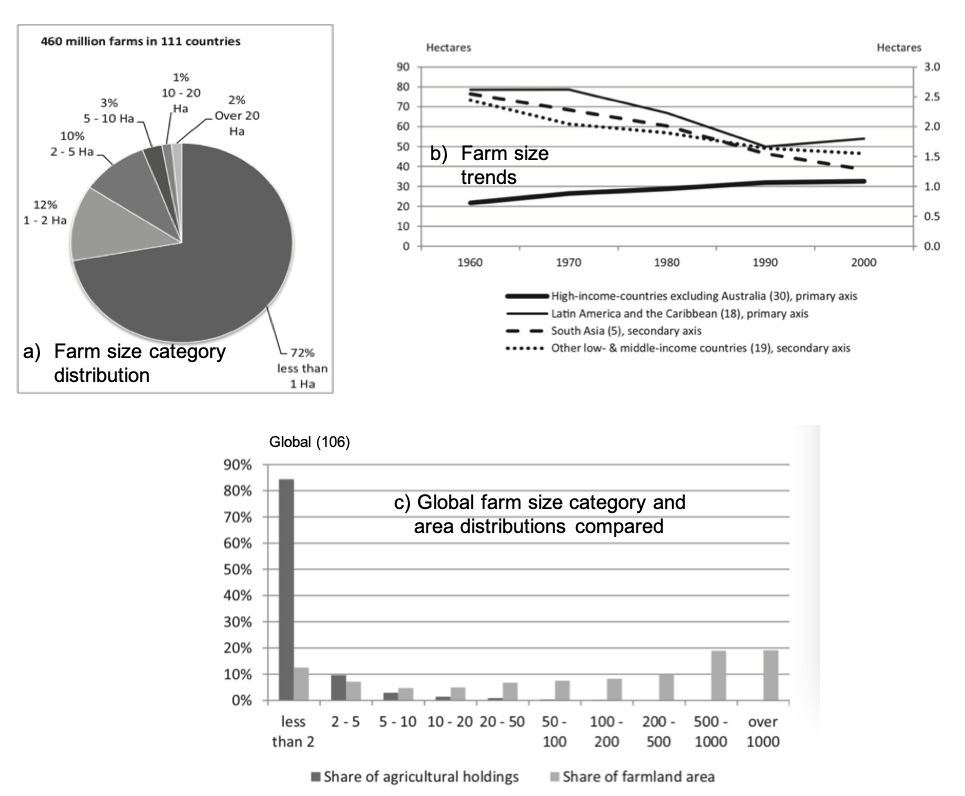
Figure S10.2 Global farm size category and area distributions and trends. (Lowder et al., 2015).
Courtesy Elsevier, Inc., http://www.sciencedirect.com. Used with permission.
Although farms over 5 ha only account for 6% of all global farms the land area they each contribute is large. To address this, the Lowder et al. paper also estimates the total cropland area in each size category. Cropland area provides a basis for comparing, for example, the relative contribution to production from smallholders, medium size farms, and large farms. The global cropland area distribution in Panel c) clearly indicates that small farms are more numerous (dark gray) but that larger farms contribute more total area (light gray). Farms smaller than 2 ha and 5 ha account, respectively, for 12% and 18% of global cropland area while farms larger than these thresholds account, respectively, for 88% and 82% of the global total area. We can expect global crop production contributions of small vs. large farms to roughly correlate with these global cropland area figures (see next section).
Figure S10.3 shows a similar plot with results for sub-Saharan Africa. Here larger farms contribute a smaller fraction of the regional total area (also, note the change in the horizontal scale). Farms smaller than 2 ha and 5 ha account, respectively, for 38% and 66% of sub-Saharan Africa cropland area while farms larger than these thresholds (but smaller than 50 ha) account, respectively, for the remaining 42% and 34% of area. This suggests that smallholder production is a major fraction of total domestic food production in sub-Saharan Africa.
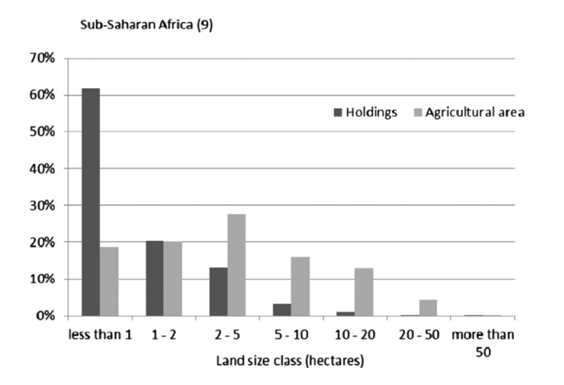
Figure S11.3 Sub-Saharan farm size category and area distributions compared (Lowder et al., 2015).
Courtesy Elsevier, Inc., http://www.sciencedirect.com. Used with permission.
A recent study by Ricciardi et al. (2018) provides smallholder cropland area estimates that are somewhat higher than Lowder et al. and are based on a somewhat smaller number of country surveys. The Ricciardi et al. (2018) paper estimates that smallholder farms less than 2 ha occupy 24% of global cropland area (rather than 18%). It also indicates that these farms generate 28-31% of global crop production and 30-34% of global calorie production. These results confirm Lowder’s conclusion that smallholder farms contribute significantly to the global food supply. The Ricciardi et al. (2018) paper does not provide results for particular regions, such as sub-Saharan Africa but it does provide size category distributions for particular crops.
References:
Steffen Fritz, Linda See, et al. 2015. “Mapping Global Cropland and Field Size.” Global Change Biology, 21, no. 5: 1980–1992.
IFAD International Fund for Agricultural Development. 2010. “Rural Poverty Report 2011 - New Realities, New Challenges: New Opportunities for Tomorrow’s Generation.” Annexes 1 and 2. IFAD, Rome
Sarah K. Lowder, Jakob Skoet, and Terri Raney. 2016. “The Number, Size, and Distribution of Farms, Smallholder Farms, and Family Farms Worldwide.” World Development, 87, 16–29.
Vincent Ricciardi, Navin Ramankutty, et al. 2018. “How Much of the World’s Food Do Smallholders Produce?” Global Food Security, 17, 64–72.


