
Adoption of genetically engineered crops varies greatly across countries due to different regulatory conditions, public attitudes, and agronomic factors. The USA has, by far, the largest genetically engineered acreage, with Brazil, Argentina, India, and Canada making up the remaining countries in the top five. Figure S12.1 shows how genetically engineered soybean, maize and cotton acreage in the US grew between 1996 and 2018. The label HT refers to crops engineered to be herbicide resistant and primarily used with glyphosate (Roundup) herbicide. The label BT refers to insect resistant crops containing a gene from Bacillus thuringiensis. Some crops combine both traits.
This plot shows a dramatic increase in the use of two important genetic engineering technologies. In 2018 the genetically engineered US maize, soybean, and cotton crop areas were all well over 90% of the total planted area.
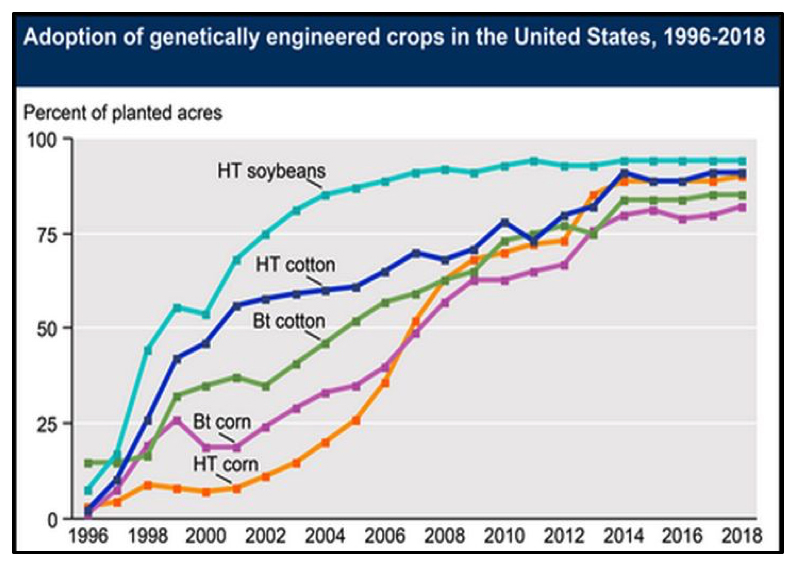
Figure S12.1: Trends in crop acreage devoted to genetically engineered cotton, maize, and soybeans.
Sources: USDA Economic Research Service (2002)
Courtesy of USDA Economic Research Service.
References:
National Agricultural Statistics Service. Annual Reports for June. 2000–2018.
US Department of Agriculture, Economic Research Service Report AER–810. 2002.
University of Michigan Extension website, “Why Many Growers Are Quick to Adopt Genetic Modification Technology.” Accessed 14 July 2020.


