
These UN population plots are based on historically reported population values before 2020 and on projections based on predicted trends in fertility (measured as total number of children per woman) starting in 2020 and ending in 2100 (UN Population Division, 2019). The total population (all genders and ages) in the designated region is presented as a median value computed from a Monte Carlo technique. The plots also include high and low fertility bounds (+- 0.5 child per woman).
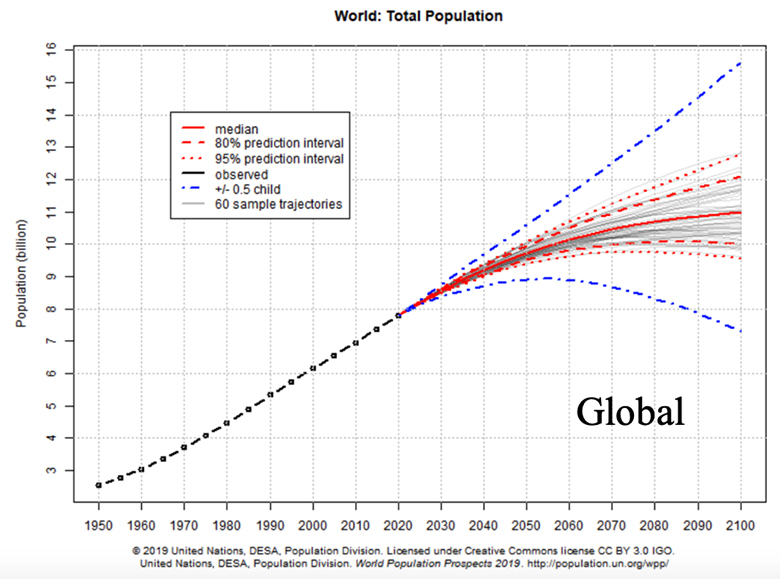
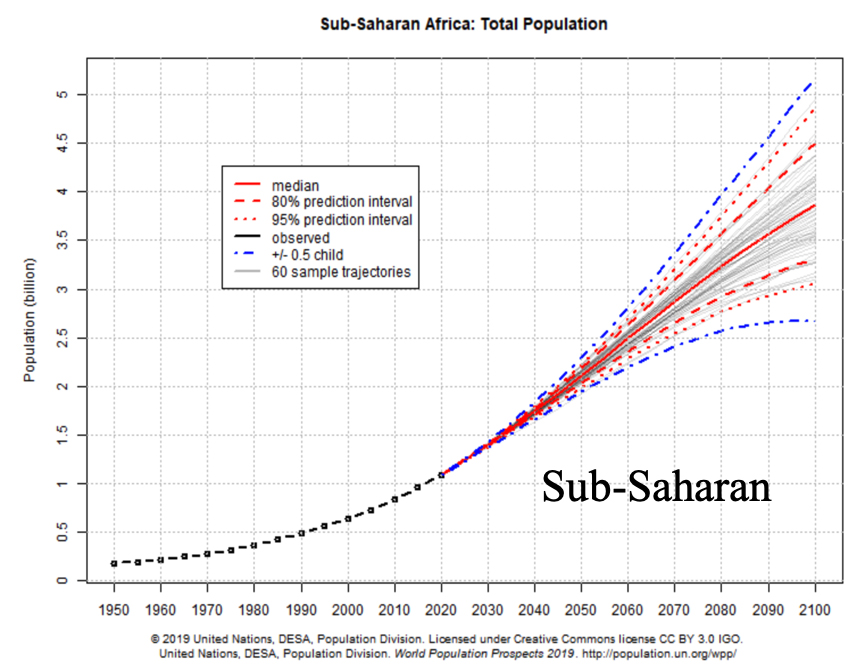
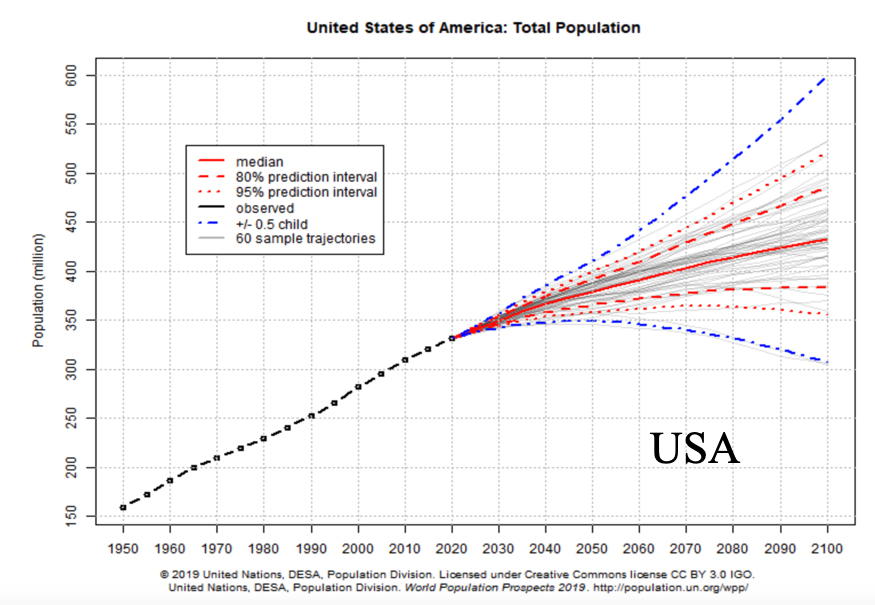
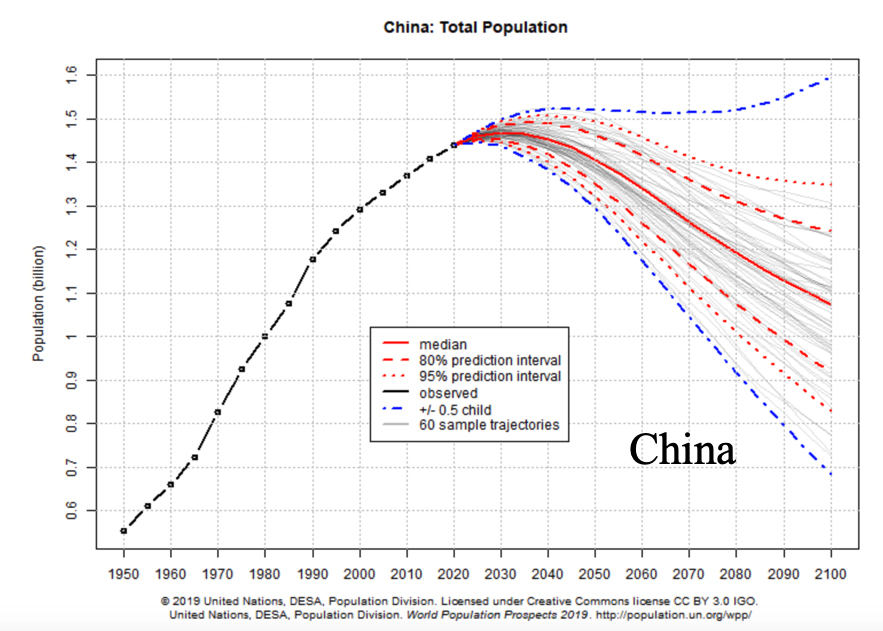
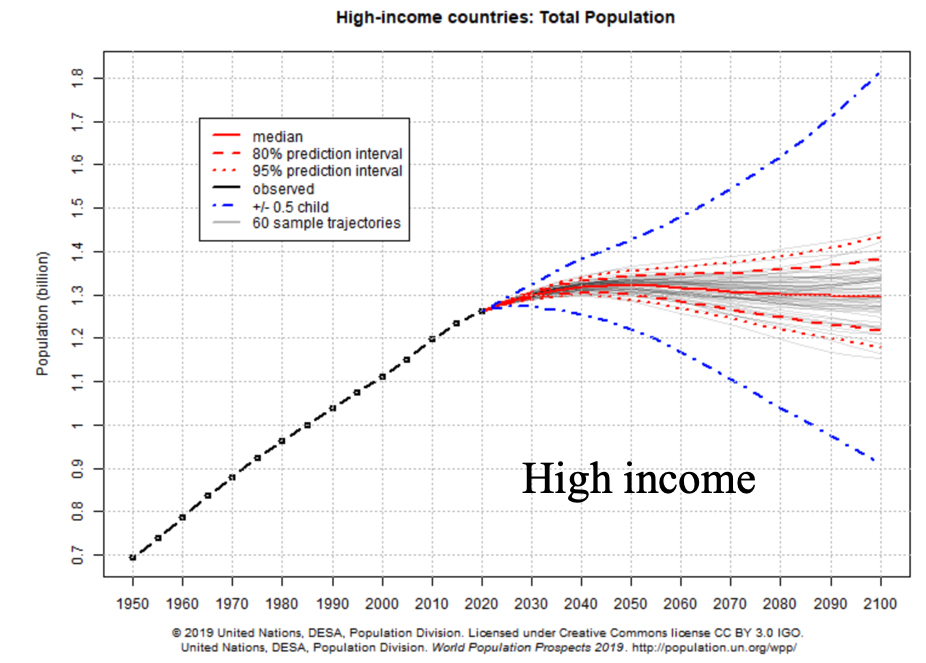
Figure S1.1 UN Estimated Population Trends (UN Population Division. 2019)
(Click each individual figure to see its bigger version.)
Courtesy UN Population Division. License: CC BY.
The global estimates in Figure S1.1 show that the population median peaks around 2100 and the low fertility variant peaks around 2055, after which the population decreases. By contrast, even the low fertility variant in the sub-Saharan Africa plot is still increasing at the end of the century. The sub-Saharan Africa median population increases by a factor of nearly 3.5 between 2020 and 2100, growing from 1.1 to 3.8 billion.
The remaining plots show much slower population trends for the US, China, and high-income countries (primarily Europe and North America). Note that the median value for China peaks around 2030 while the high-income median value peaks around 2045. These results indicate that population will be growing primarily in countries that are currently lower income.
Figure S1.2 shows an estimated global population density map for 2000 (Salvatore et al, 2005). The spatial resolution is 30 arc seconds (1 km2 at the equator). Note the high population density in the generally water limited areas of the Middle East, East Africa, South Asia, and northern China (see the comparison to climate maps shown in S8).
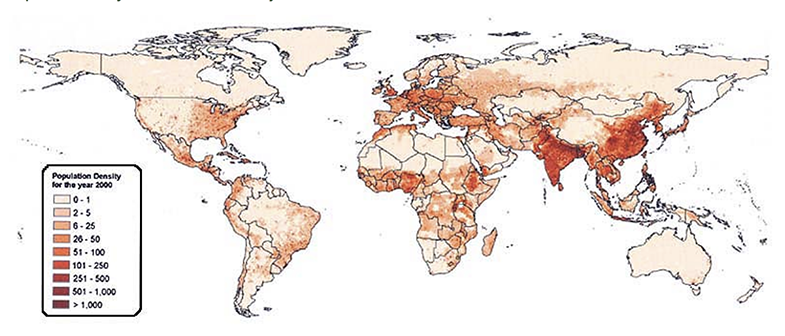
Figure S1.2 Population Density (Salvatore et al., 2005).
© FAO. All rights reserved. This content is excluded from our Creative Commons license.
For more information, see https://ocw.mit.edu/help/faq-fair-use/.
25847661figs13popjpg99471414
Figure S1.3 Fertility rates over three time periods (UN Population Division. 2019).
(Click the figure to see a bigger popup image.)
Courtesy UN Population Division. License: CC BY.
The maps in Figure S1.3 above show UN fertility rate estimates (in number of children per woman) over two periods in the past and for 2050–2055 (UN Population Division, 2019). The demographic transition that reduced population growth in much of Asia and South America between 1970 and 2015 is apparent. Although African fertility rates also dropped over this period they were still much higher than elsewhere. In some African countries the 2010–2015 average fertility rate was well above 5 children per woman. However, the UN predicts that most countries in Africa will have lower fertility rates by 2050–2055. This suggests that the pressure on African food supplies may gradually become less intense in the second half of the twenty-first century, although the population will still be growing.
Figure S1.4 indicates that there are reasonably strong relationships between fertility rate and per capita income and between fertility rate and childhood mortality in different countries (Gapminder, 2019). Here fertility is measured by the number of children per woman and childhood mortality is measured as mortality for ages 0–5 per thousand born. Each country in the chart is indicated with a colored circle, with an area proportional to the national population. Countries with higher income tend to have lower fertility rates while those with higher childhood mortality tend to have higher fertility rates. Population predictions often rely on trends in explanatory variables such as income and childhood mortality to forecast fertility rates.
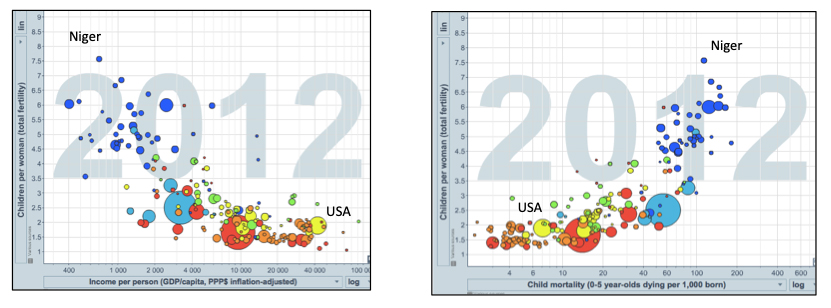
Figure S1.4 Effects on fertility (number of children per woman) of a) per capita income and
b) childhood (0–5 year mortality per thousand born), in 2012 (Gapminder, 2019)
© Google. All rights reserved. This content is excluded from our Creative Commons license.
For more information, see https://ocw.mit.edu/help/faq-fair-use/.
References:
UN Population Division. 2019. Department of Economic and Social Affairs, Population Dynamics. World Population Prospects 2019.
Mirella Salvatore, Francesca Pozzi, et al. 2005. Mapping Global Urban and Rural Population Distributions. Environment and Natural Resources Working Paper 24, FAO, Rome, 2005.
Gapminder Tools site. 2019.


