
Lambin and Meyfroidt (2011) from Class 2 and many others believe that rain forests should not be included in an inventory of available cropland. Nevertheless, rain forest is still being converted to cropland at high rates.
These figures from Achard et al. (2002) show that the lost forest area in some areas of the Amazon and southeast Asia was up to 50% of total forested land over one decade, 2000–2010. The gross loss of forest cover appears in orange circles while gross loss from other woodland areas appears in yellow circles. The range is 0–100% loss over the decade, indicated by the size of the circles.
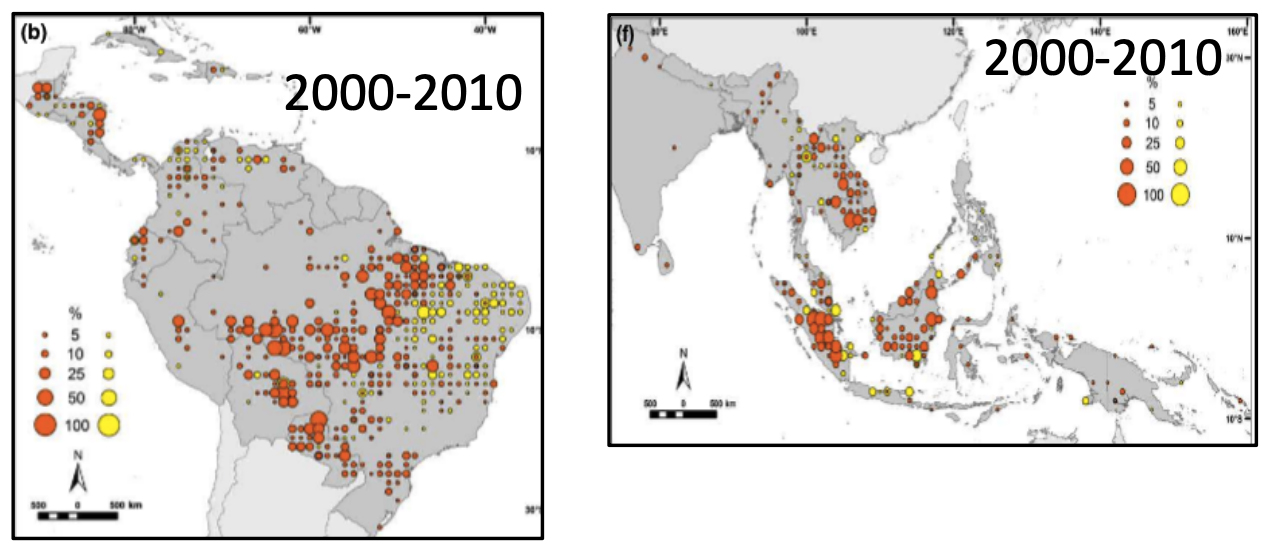
Figure S7.1 Lost forest area in the tropics (Achard et al., 2014)
Maps from Achard et al. 2014. “Determination of Tropical Deforestation Rates and Related Carbon Losses
from 1990 to 2010.” Global Change Biology. 20, no. 8: 2540–2554. © The Authors Global Change Biology.
All rights reserved. This content is excluded from our Creative Commons license.
For more information, see https://ocw.mit.edu/help/faq-fair-use/.
The following charts from Hansen et al. (2013) give estimated annual forest loss totals for Brazil and Indonesia from 2000 to 2012. The annual forest loss increment is the slope of the estimated trend line in each chart. Although Brazil’s losses decreased over the plotted period, they are still substantial. Tropical forest loss rates change substantially over time, depending on government policies. It is likely that Brazil’s rates increased at times after 2012.
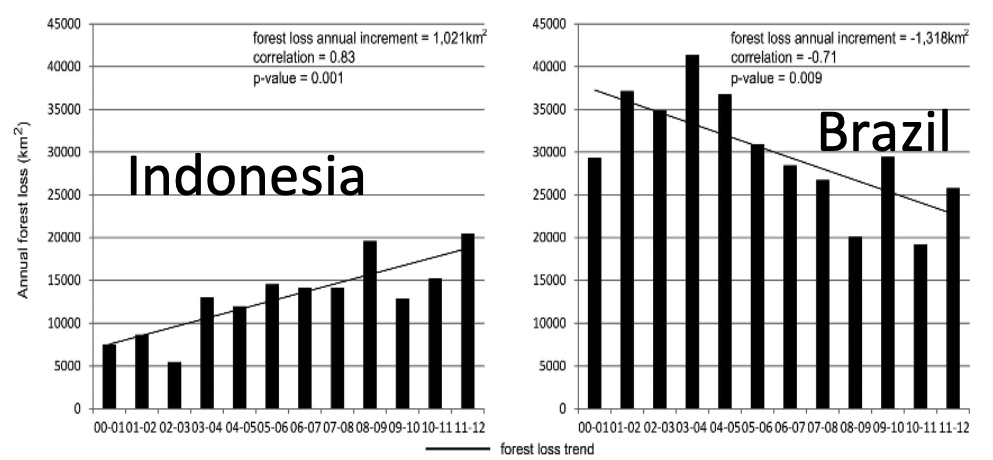
Figure S7.2 Deforestation trends in Indonesia and Brazil (Hansen et al., 2013)
Figures from Hansen et al. 2013. “High-Resolution Global Maps of 21st-Century Forest Cover Change.”
Science. 342, no. 6160: 850–853. © AAAS. All rights reserved. This content is excluded from
our Creative Commons license. For more information, see https://ocw.mit.edu/help/faq-fair-use/.
Deforestation is not confined to the tropics. This image from Hansen et al. (2013) shows losses in the US and Russia as well.
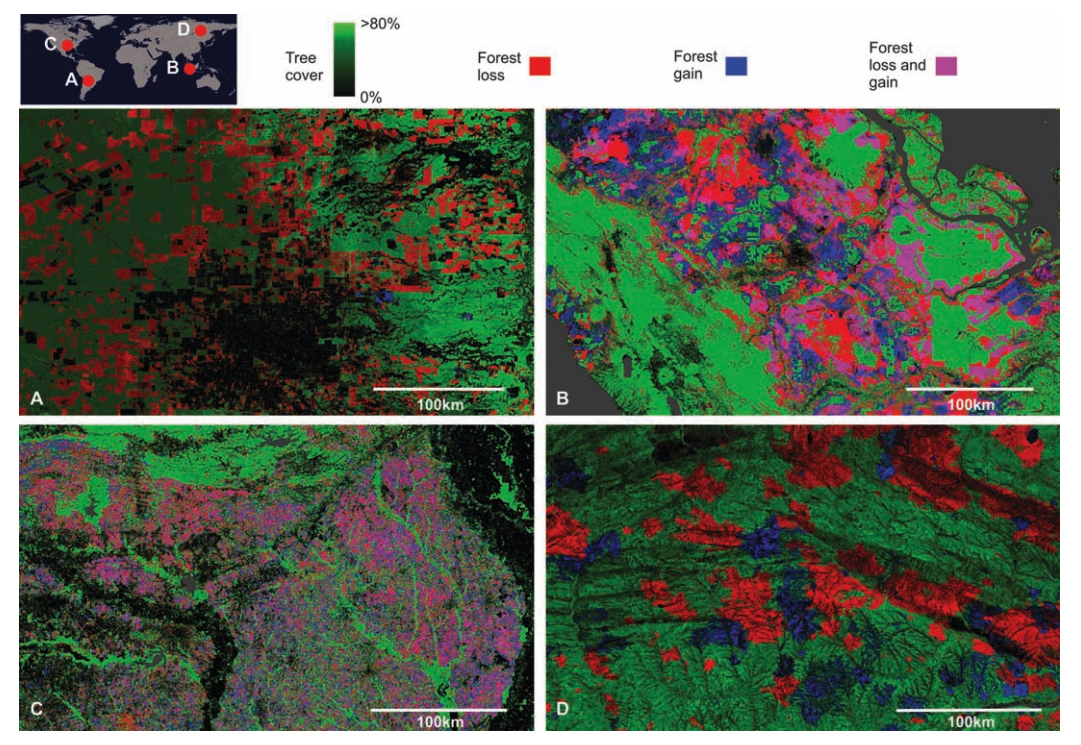
Figure S7.3 Images showing loss of forest cover in a) Paraguay, b) Indonesia, c) United States, and d) Russia (Hansen et al., 2013)
Figures from Hansen et al. 2013. “High-Resolution Global Maps of 21st-Century Forest Cover Change.”
Science. 342, no. 6160: 850–853. © AAAS. All rights reserved. This content is excluded from
our Creative Commons license. For more information, see https://ocw.mit.edu/help/faq-fair-use/.
References:
F. Achard, H. D. Eva, et al. 2002. “Determination of Deforestation Rates of the World’s Humid Tropical Forests.” Science. 297, no. 5583: 999–1002.
M. C. Hansen, P. V. Potapov, et al. 2013. “High-Resolution Global Maps of 21st-Century Forest Cover Change.” Science. 342, no. 6160: 850–853.
Eric F. Lambin, Patrick Meyfroidt. 2011. “Global Land Use Change, Economic Globalization, and the Looming Land Scarcity.” Proceedings of the National Academy of Sciences. 108, no. 9: 3465–3472.


