
Several of the maps provided here summarize the spatial and seasonal variability of climate variables relevant to crop production. Additional maps show the distribution of actual agricultural land (both crop and grazing land), land estimated to be suitable for some crop production, and the cereal yield attained in major cropland regions. Although the factors that influence agricultural suitability are complex some correlation is apparent in temperate latitudes between regions with favorable climate and intensive higher yield agriculture. The lower intensity of agriculture in tropical regions is due, at least in part, to less favorable soils.
Climate Classification
The Köppen climate classification scheme gives a general picture of the variability of climatic conditions important for agriculture, reflecting primarily temperature and moisture. The subsequent figures give more detailed information on particular climatic variables.
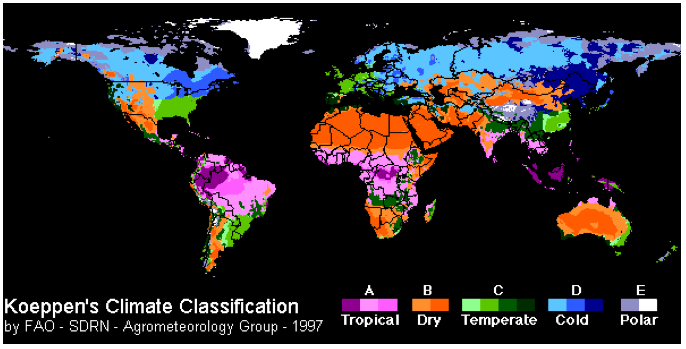
Figure S8.1 Köppen global climate classification, 1997.Source: FAO Climate impact on agriculture program
© FAO. All rights reserved. This content is excluded from our Creative Commons license.
For more information, see https://ocw.mit.edu/help/faq-fair-use/.
Precipitation
Total Annual Precipitation
Note the relatively high annual rainfall in temperate mid-latitude areas of Europe and North and South America and in much of the tropics.
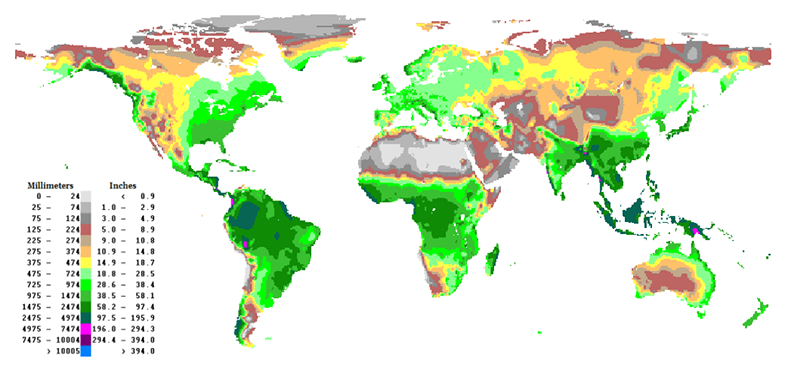
Figure S8.2 Multi-year average annual total global precipitation.
Source: Leemans and Cramer (1991) and FAO Climate impact on agriculture program
© FAO. All rights reserved. This content is excluded from our Creative Commons license.
For more information, see https://ocw.mit.edu/help/faq-fair-use/.
Monthly Precipitation Comparison (seasonality)
Note the high seasonal variability in the subtropics (India and China, East and West portions of sub-Saharan Africa), and parts of temperate North and South America.
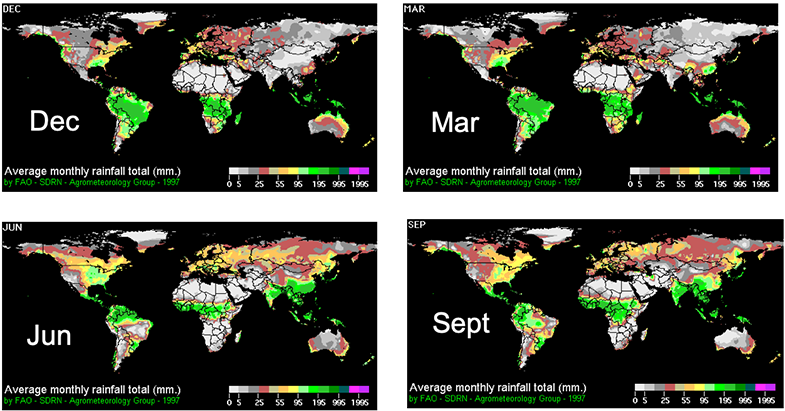
Figure S8.3 Multi-year average monthly total global precipitation for Dec, March, June, and September.
Source: Leemans and Cramer (1991) and FAO Climate impact on agriculture program
© FAO. All rights reserved. This content is excluded from our Creative Commons license.
For more information, see https://ocw.mit.edu/help/faq-fair-use/.
Growing Degree Days
The Growing Degree Day (GDD) value is the integral over time of daily temperatures above the baseline value. Different crops have different baseline temperatures and minimum GDD requirements. The baseline temperatures used in this map are described in Licker (2010). Growing seasons are generally longer and warmer where GDD is higher.
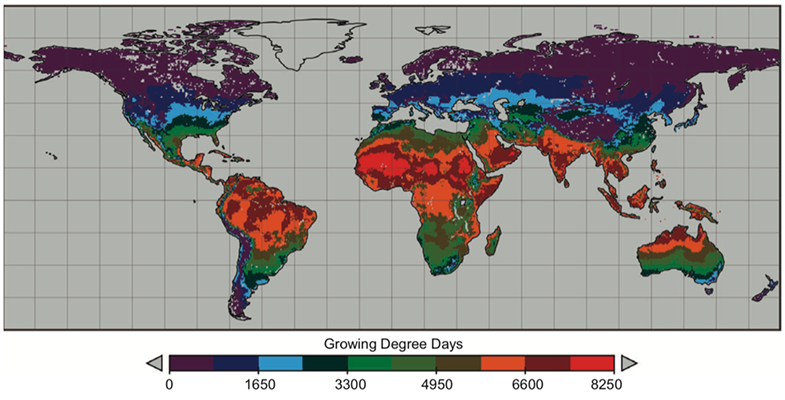
Figure S8.4 Crop growing degree days for a baseline temperature of 8oC. Source: Licker et al. (2010)
© John Wiley & Sons, Inc. All rights reserved. This content is excluded from our Creative Commons license.
For more information, see https://ocw.mit.edu/help/faq-fair-use/.
Soil Moisture Availability
The soil moisture index mapped here is the ratio of estimated actual (water limited) evapotranspiration to the estimated potential (not water limited) evapotranspiration averaged over the year for ca. 2010 land use. Note that more soil moisture is available in the tropics and in temperate areas in North America, Europe, and East Asia. Agricultural areas with lower soil moisture availability include India, and parts of southern Africa, Patagonia, and the southwestern US.
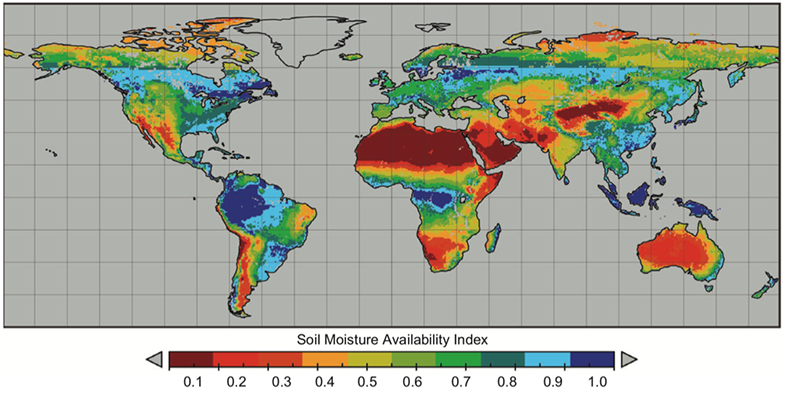
Figure S8.5 Multi-year average soil moisture availability. Source: Licker et al. (2010)
© John Wiley & Sons, Inc. All rights reserved. This content is excluded from our Creative Commons license.
For more information, see https://ocw.mit.edu/help/faq-fair-use/.
Distribution of Agricultural Land
This map superimposes estimated predominantly cropland (green) and grazing land (brown) area fractions with cropland/grazing mosaic (yellow), ca 2000. The concentration of cropland in the northern hemisphere is apparent.
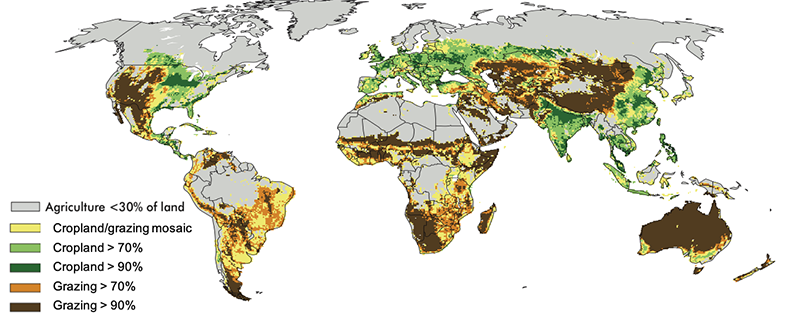
Figure S8.6 Global distribution of agricultural land, indicating primarily cropland, primarily grazing land, and a mosaic of both. Source: Adapted from Global Environment Outlook (GEO) and UN Environment Program (UNEP, 2010). Based on data from Ramankutty et al (2008)
Courtesy UN Environment Program.
Crop Suitability
In this map suitability implies that it is possible to grow at least one rainfed or irrigated crop from an extended list of candidate crops. The Zabel et al. approach considers soil properties, terrain, rainfall, and temperature when determining suitability for any given crop.
It is interesting to compare Zabel’s potentially suitable cropland with the cropland portion of the UNEP map. The tropical rainforests of South America, Africa, and parts of tropical Australia and Indonesia had relatively little cropland ca. 2010. Zabel classifies some of this land as low suitability. However, some of it, especially in Indonesia and Australia, is classified as sufficiently suitable to be attractive for agricultural development, at least in the short term. Such assessments should be viewed with some skepticism, considering the simplicity of the Zabel suitability analysis and the uncertainty in soils data from these regions.
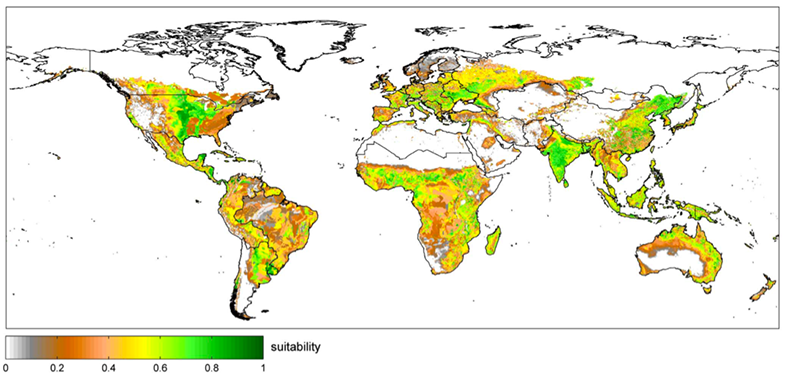
Figure S8.7 Global crop suitability map. Source: Zabel et al. (2014) (see Class 4)
© PLOS. All rights reserved. This content is excluded from our Creative Commons license.
For more information, see https://ocw.mit.edu/help/faq-fair-use/.
Crop yield
This figure from the Mueller et al. (2012) reading of Class 5 illustrates global yield gaps for staple grains (maize, wheat, and rice) ca. 2000. The pixels of this gridded map show the ratios (in percent) of the weighted average observed staple grain yields to the corresponding attainable yield values. The attainable yield (or yield potential) for each pixel is obtained by averaging 95 percentile yields in all pixels that have similar climates (annual precipitation and growing degree days) but may have different fertilizer and irrigation inputs. An average-to-attainable ratio of 100% in a given pixel indicates that the yield gap there is zero. Ratios less than 100% indicate non-zero yield gaps.
The map shows that the major “breadbasket” regions in central North America, eastern South America, western Europe, India, and eastern China are closer to attainable values while parts of Africa, Mexico, and Asia are significantly below attainable values, indicating large yield gaps. Similar displays can be generated for other crops (Licker et al, 2010).
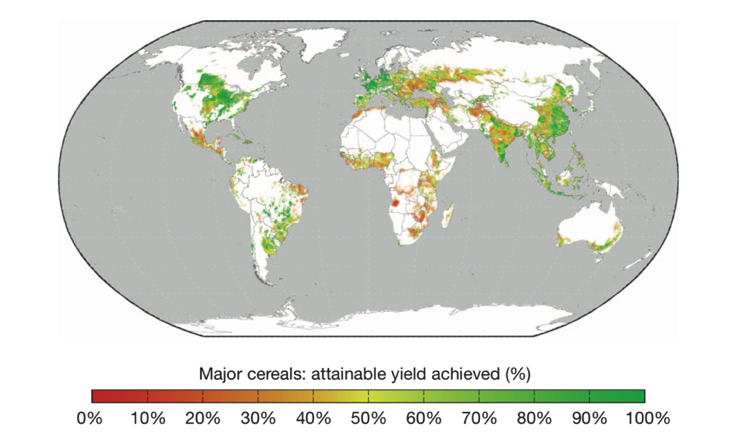
Figure S8.8 Global map of percentage of attainable yield obtained for a weighted average of cereal crops.
Source: Mueller et al. (2012) (see Class 5)
© Springer Nature Limited. All rights reserved. This content is excluded from our Creative Commons license.
For more information, see https://ocw.mit.edu/help/faq-fair-use/.
References:
R. Leemans and W. Cramer. 1991. The IIASA Database for Mean Monthly Values of Temperature, Precipitation and Cloudiness on a Global Terrestrial Grid (PDF - 3.69MB). Research Report RR-91-18. November 1991. International Institute of Applied Systems Analysis, Laxenburg, pp. 61.
Rachel Licker, Matt Johnston, et al. 2010. “Mind the Gap: How Do Climate and Agricultural Management Explain the ‘Yield Gap’of Croplands Around the World?” Global Ecology and Biogeography, 19, no. 6: 769–782.
Nathan Mueller, James Gerber, et al. 2012. “Closing Yield Gaps Through Nutrient and Water Management.” Nature, 490, no. 7419: 254–257.
Navin Ramankutty, Amato T. Evan, et al. 2008. “Farming the Planet: 1. Geographic Distribution of Global Agricultural Lands in the Year 2000.” Global Biogeochemical Cycles, 22, no. 1.
Florian Zabel, Birgitta Putzenlechner, and Wolfram Mauser. 2014. “Global Agricultural Land Resources—A High Resolution Suitability Evaluation and Its Perspectives until 2100 under Climate Change Conditions.” PloS One. 9, no. 9.


